Sunday, December 11, 2016
Monday, February 15, 2016
Simple Burndown charts in Microsoft Excel

The primary idea of this blog is to introduce some basic idea of a Burndown Chart. Now, many people reading this will be familiar with various Project Management methodologies, including Agile & Burndown Charts already, so it's not really aimed at you, sorry. Anyway, take comfort in that there are many far better systems out there and you probably already use them.
However, if you are unfamiliar with the idea of Burndown Charts, the idea is to track the progress of a project (or phase, sprint or whatever you wish to call it, but a definable section of the project).
So in this blog, we will have a fictitious project that is planned to last 10 days. There will be 27 planned tasks to be completed during this time, to complete the project. To keep it simple for demonstration purposes, I we have broke the tasks into 3 tasks to be completed a day. This also gives a tolerance of an estimated day, which could bring the project in a day early. Always better to look better bringing the project in on time or early than overestimating and not completing on time. Again, this blog is aimed at people with limited exposure to Project Management and Burndown Charts.
Lets explain how this is done.
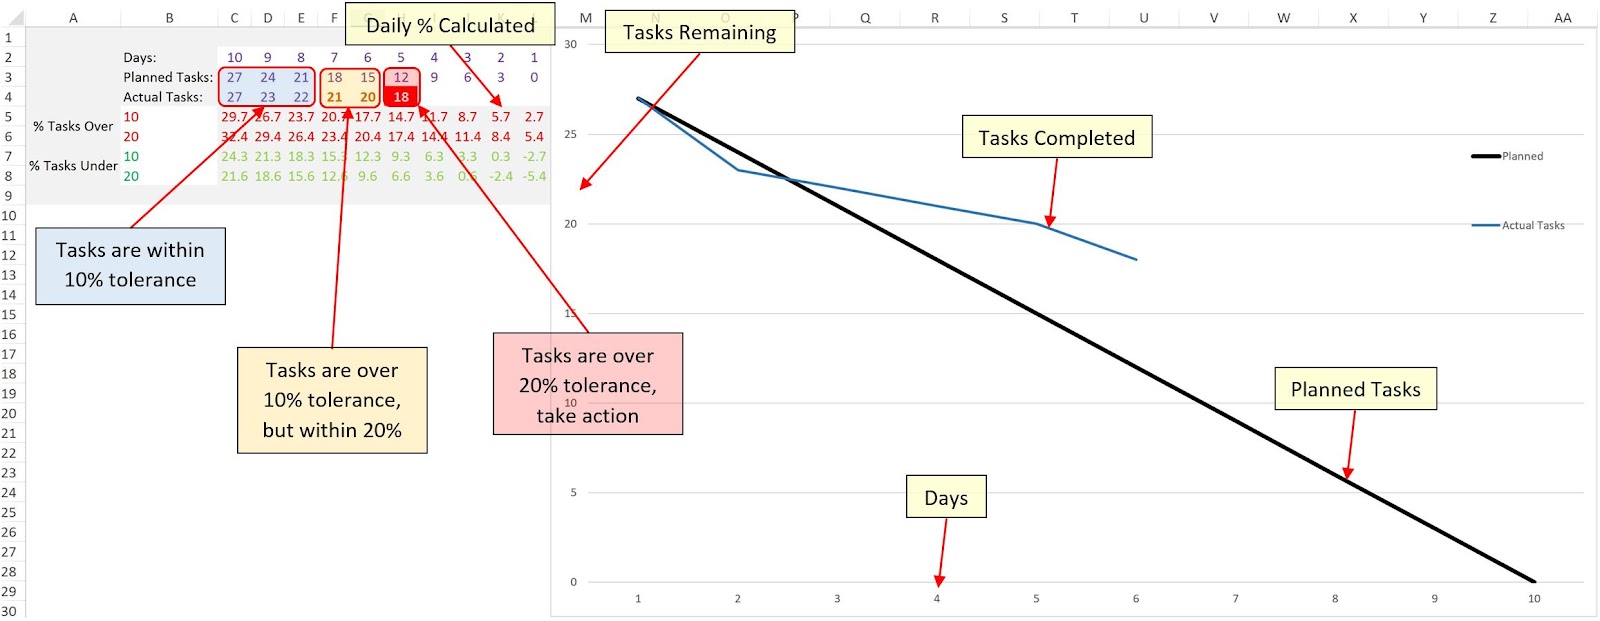
The table was created on the left:
- It has days running down from 10 to 1.
- The Planned Tasks are reduced by 3 each day, meaning that the plan is to complete 3 tasks per day.
- The Actual Tasks are logged. Showing the first 3 days are within plan. Note, that the 3rd day is one task over, this is not highlighted as we have set a 10% tolerance and one task is within this.
- However, the 4th and 5th days show the project starting to fall behind, they have broke the 10% tolerance and are highlighted.
- The 6th day has now broke the 20% tolerance and is more defined. Immediate action now needs to be taken to get the project back on track.
The graph is based on Days, Planned Tasks and Actual Tasks:
- This gives a visual representation of how the project is performing.
- you will notice that on day 3 the completed tasks break the projection to show potential issues.
This is all very simple and handy to keep an eye on a simple project, but let's have a look at a couple of other ideas showing the tolerance in the graph.

Here we have added the tolerance values to the graph. You can set your own tolerance and as long as the blue line (representing the state of project) remains within the tolerance line, then it's going well :)
I have also tolerance for the project being completed too quick, if this does happen then questions still have to be asked. Is the quality still attended, has it been misestimated, can resources be better used elsewhere?
The good thing about using this method is that if you are 20% under you can easily see that the project will be complete in 8 days.
However, an issue is that the tolerance remains the same throughout the life cycle of the project. It may be more useful to take into effect the fact of the time remaining. Meaning that with 2 days to go breaking the 20% tolerance may cause major issues and panic :)
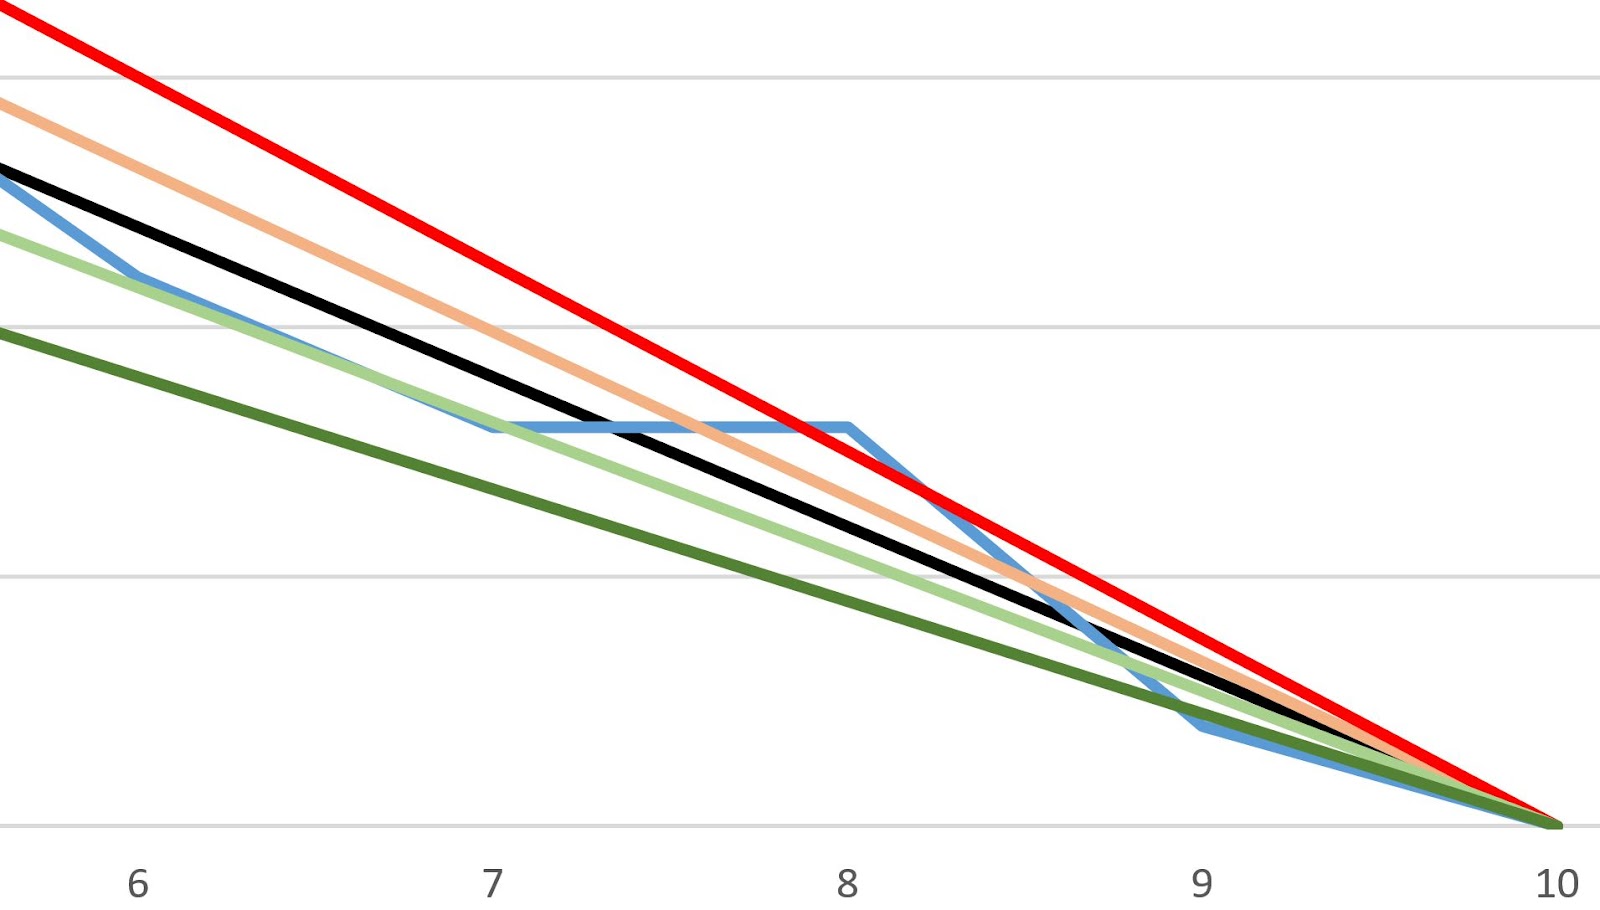
So the next image shows bringing the Burndown Chart to an end point, which in theory should focus on the completion date and adjust the tolerance lines accordingly.

Notice that the blue line (project) breaks the 20% tolerance on day 8, whereas this was not even highlighted in the previous example. The reason is that this method is taking into account the remaining days, which in this case is 2 days. It was planned that at this stage of the project there would be 6 tasks left to complete, and there are actually 8 tasks left and a very short time to complete them to bring the project in on time.
A zoomed in section of the graph:
So there you have it.. As mentioned, this is aimed at people with little exposure to projects or Burndown Charts / methodologies.
Most project management tools will offer inbuilt charts and projections, so have a look at some of them, but hopefully this has given you an insight of one way to keep an eye on how your project is performing.
If you want, you can download and play about and look at the formulas etc, with the spreadsheet from the side menu.
As always, thanks for reading & I hope you enjoy...
keep learning
Friday, February 12, 2016
Using Microsoft Excel for Random Living Art
Using Microsoft Excel for Random Living Art :)
I am not going to do the usual walk through & how to in this blog. What I will do however is have the file downloadable, so you can play about with it yourself.
As a synopsys, I have a random value assigned to the cells (=RAND()*$AD$40), where the cell AD40 holds the value to have the RAND function operate.
The cell has then Conditional Formatting Rules set up. Various colours for various random values.

I have then set up a timer function that gets its values from the cell as shown below:

Please note, that you will have to enable macros to view the ever-updating images. Now, personally my advice is only run macros from trusted sources. So you can either pop in and check the code out for yourself first or just make any change anywhere on the sheet and it will update manually.
So if you want, you can download and play about with the spreadsheet from the side menu:
As always, thanks for reading & I hope you enjoy...
keep learning
Friday, January 8, 2016
How I got from 44 Twitter Followers to over 1300 in one month
Just a few notes on how I managed to massively (for me) up my Twitter Follower count.
First off, I did not use any tools (later, used IF to automate posts, but that's all), nor pay for any followers, I just used a few ideas from others and myself and came up with the plan below and it seemed to work. I actually increase my follower count by over 500 in 5 days between Christmas and the 29th of December 2015. So thought I would share…

Screenshot taken 7th January 2016
So to anyone who has followed me since early December 2015, thanks very much, it is because of you I can write this article. I truly do appreciate the support, retweets and engagement that this journey has taken me on and look forward to much more.
Many of you will have 12k, 20k, 300k followers and quite obviously you all know a lot more than I do about this. I offer nothing on Twitter and do not aim to gain from more followers, however in the interest of transparency, I do have Google Adsense on my blog & website.
Okay, this is how I did it:
- Follow people
- Follow people that have the same interests, or that you find interesting.
- An example here, is that I love photography and art, so have followed many photographers and artist, same as books and authors / publishers, and of course I am a tech nerd so I follow lots of tech.
- This now puts me in several categories for other looking to follow people interested in art, books and tech, etc..
- Look for people with a high follow rate ratio
- There is more chance they will follow you back.
- Twitter is a quid pro quo online society, and it is polite to follow people that have followed you, helps their follower count and everyone benefits. Now, that does not mean follow everyone that follows you, as their are many inappropriate accounts out there.
- An example of a high follow rate, if you like their content follow and they most likely will follow back.

- After you follow someone
- You will be offered other similar people to follow, check these out.
- If you follow one of these, again you will be offered further similar people to follow and so on.
- This is a great way to follow authors of a particular genre, or artist or anything for that matter.
- Use the Twitter site on the PC / laptop
- It will show 6 people to follow, whereas the app only shows 3.
- Work up and down the list.
- This will show you people followed based on who you already follow.
- Therefore by following some of these people, you inturn will be shown on this list to others.
- Actively Tweet & Retweet
- Pick the best times to Tweet
- When is Twitter mostly used in your area, no point Tweeting about something local at 3am, when there is a low audience.
- I believe before just 9 am and just after 6 pm are supposed to be the best times - check yourself!!
- If aiming at a more international audience, work to their time zones.
- Tweet items of interest to your followers
- This may seem obvious, but really very few people are interested in that you “are just relaxing with a coffee”
- Photos is my thing, so I do try to Tweet the best, may not seem it :)
- Tweet every day
- At least 2 or 3 times
- This can be anything of interest, from a web page, news article or anything, but do try to be active.
- There are programs that show inactive users, and this will increase your chances of being unfollowed.
- Retweet and like items of interest
- Especially if they have a high Retweet_count, this most probably means a lot of people do like the Tweet.
- An example of a relatively high Retweet and like.
- Don't be scared to retweet great tweets or photos of relevance, this is what Twitter is about.
- Use hashtags & mention people
- Use hashtags
- This will help people find your Tweet when they search for your hashtag. Example: #Portstewart
- Mention people of interest
- They may Retweet, or acknowledge it, which in turn will get your Tweet further exposure. Example: @IMHAPPYteam
- Check what hashtags are trending
- Use if applicable in your tweet for maximum exposure.
So there you have it, simple basic, but effective. I did put a fair bit of effort into who I followed and checked every single account before I followed them. Some inappropriate accounts did get through, but it was only a handful and I just unfollow as and when they post inappropriate posts.
After I got my Follower count up, I did use IF (IFTTT) to automate post of NASA photo of the day, breaking news and NY Times breaking news. If you seen my photos, you will understand I needed better content :)
As always, thanks for reading...
keep learning
Thursday, January 7, 2016
IF - Put the internet to work for you - Log all Tweets from a selected area.

In this blog, I aim to show you a nifty little trick that will let you log all tweets from any location. Although, please note that IF can do a lot more than just work with Twitter.
Why would you want to do that?? You may have your own reasons, but other reasons may be to see what people are tweeting about at a conference, festival, disaster area or even an airport. Now, you could search for that location, or keywords, but say some are not using any of the keys words, then you will not get their Tweets.
You can also just set it up to log Tweets from your local area, football grounds or work location. this will give you a great insight to general feeling in the area. I would set it up for Newcastle United's ground, but think I would be overwhelmed with the current negativity :(
As always, there are more than one way to do this and you can actually do geocode searches in Twitter, but you need a way of getting the geocode for the area you want.. The other advantage of logging the Tweets is that you can run your own data analysis on them.
This blog assumes that you have IF (IFTTT), Twitter and Gmail accounts.
So lets get started..
- Login in to IF and click on My Recipes. Note, you can do a search to see if there are any recipes that work for you.

- Now click on Create a Recipe.

- Now you want to set the trigger, in other words if this happens then do something. so click on this.

- You are now presented with all the available channels, either start typing Twitter to search for it or scroll down and select the Twitter icon.

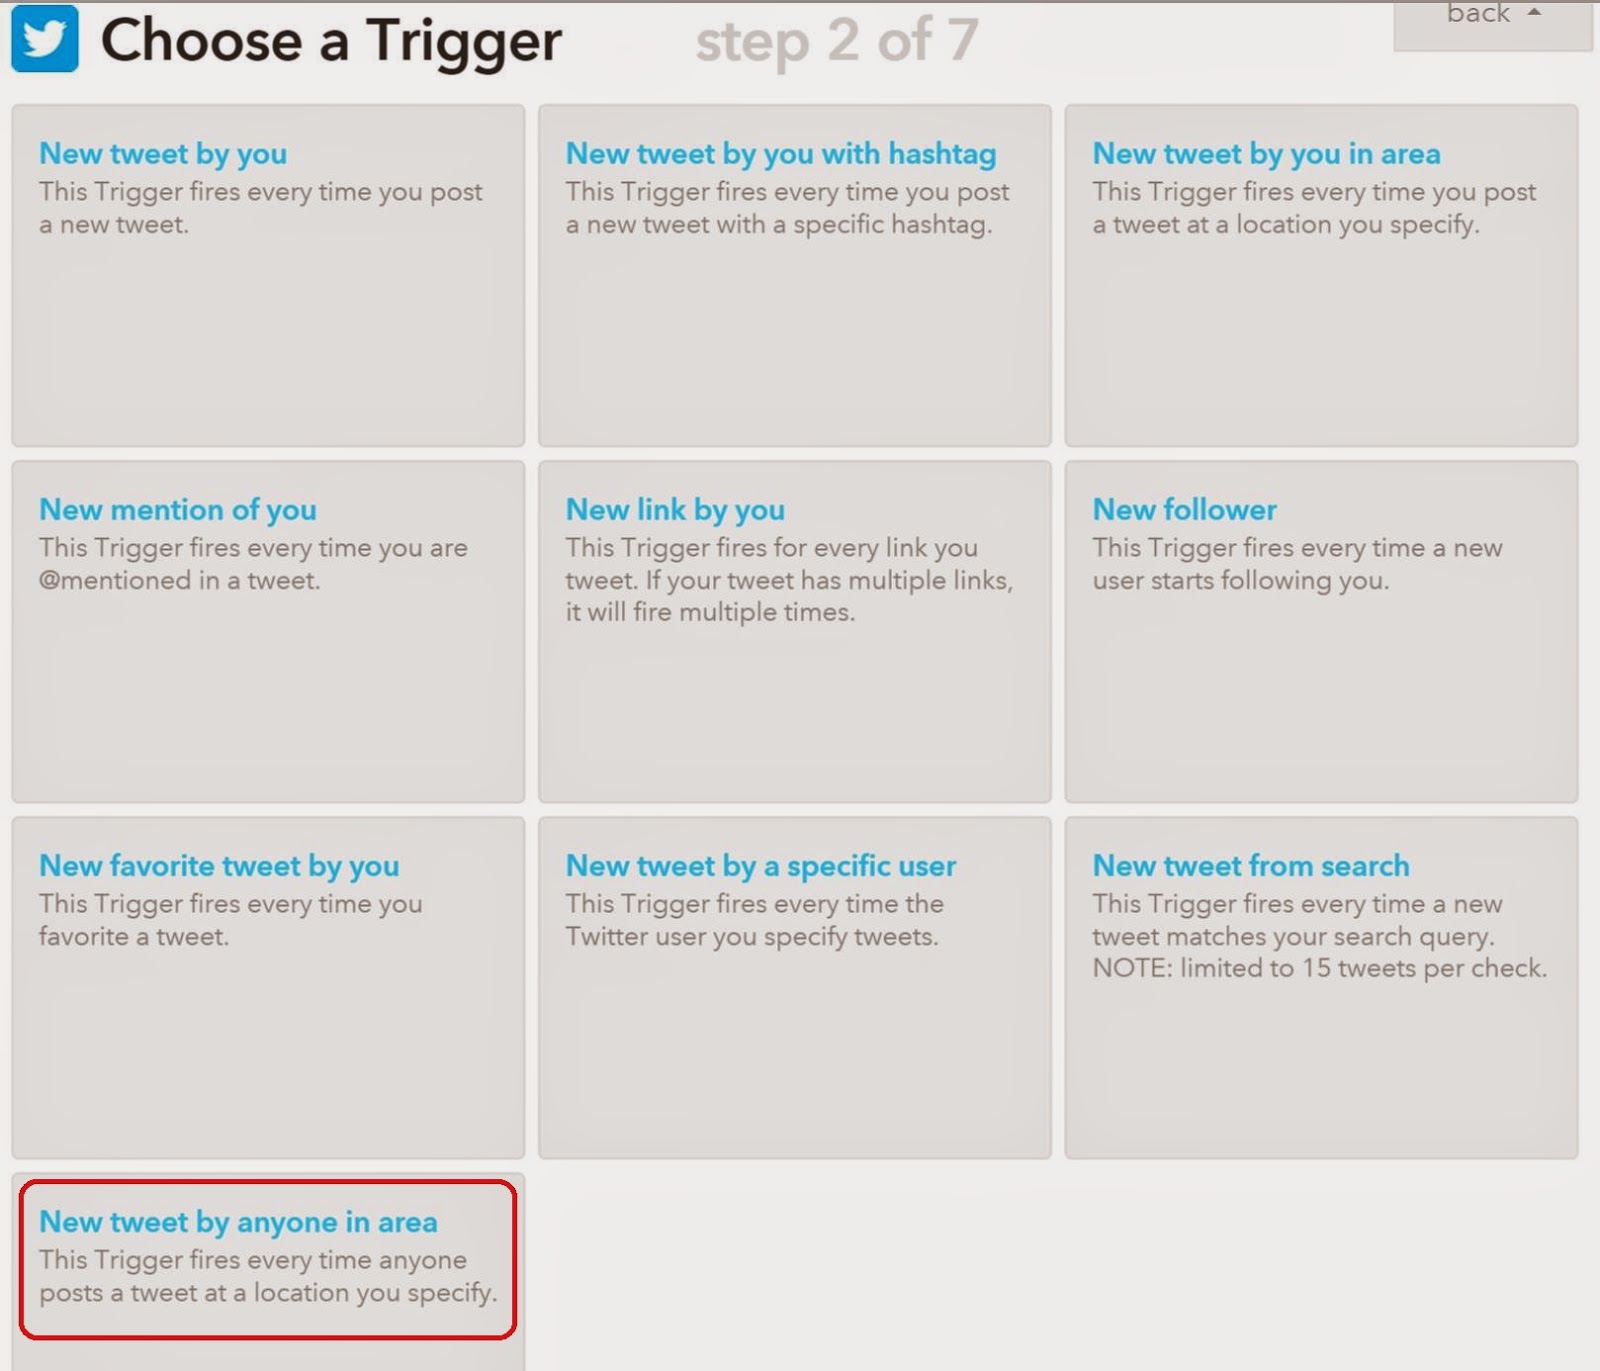
- You now have several choices of how you wish to trigger the action. We will select the New tweet by anyone in your area.
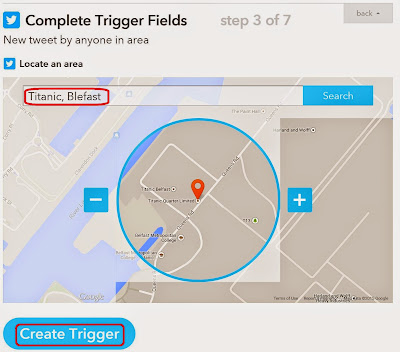
- I will create this recipe to record all the Tweets coming from the Titanic Museum in Belfast. So just type the location you are interested in and click on Search. Now you can set you size of the capture area and then click on Create Trigger.

- So that's the trigger set. Now we want to do something useful every time a Tweet is sent from our selected area. In this tutorial, we will record the Tweet and its details to a Google Sheet. So we will set the action by clicking on that.

- You are now asked to select an action, select Google Drive.

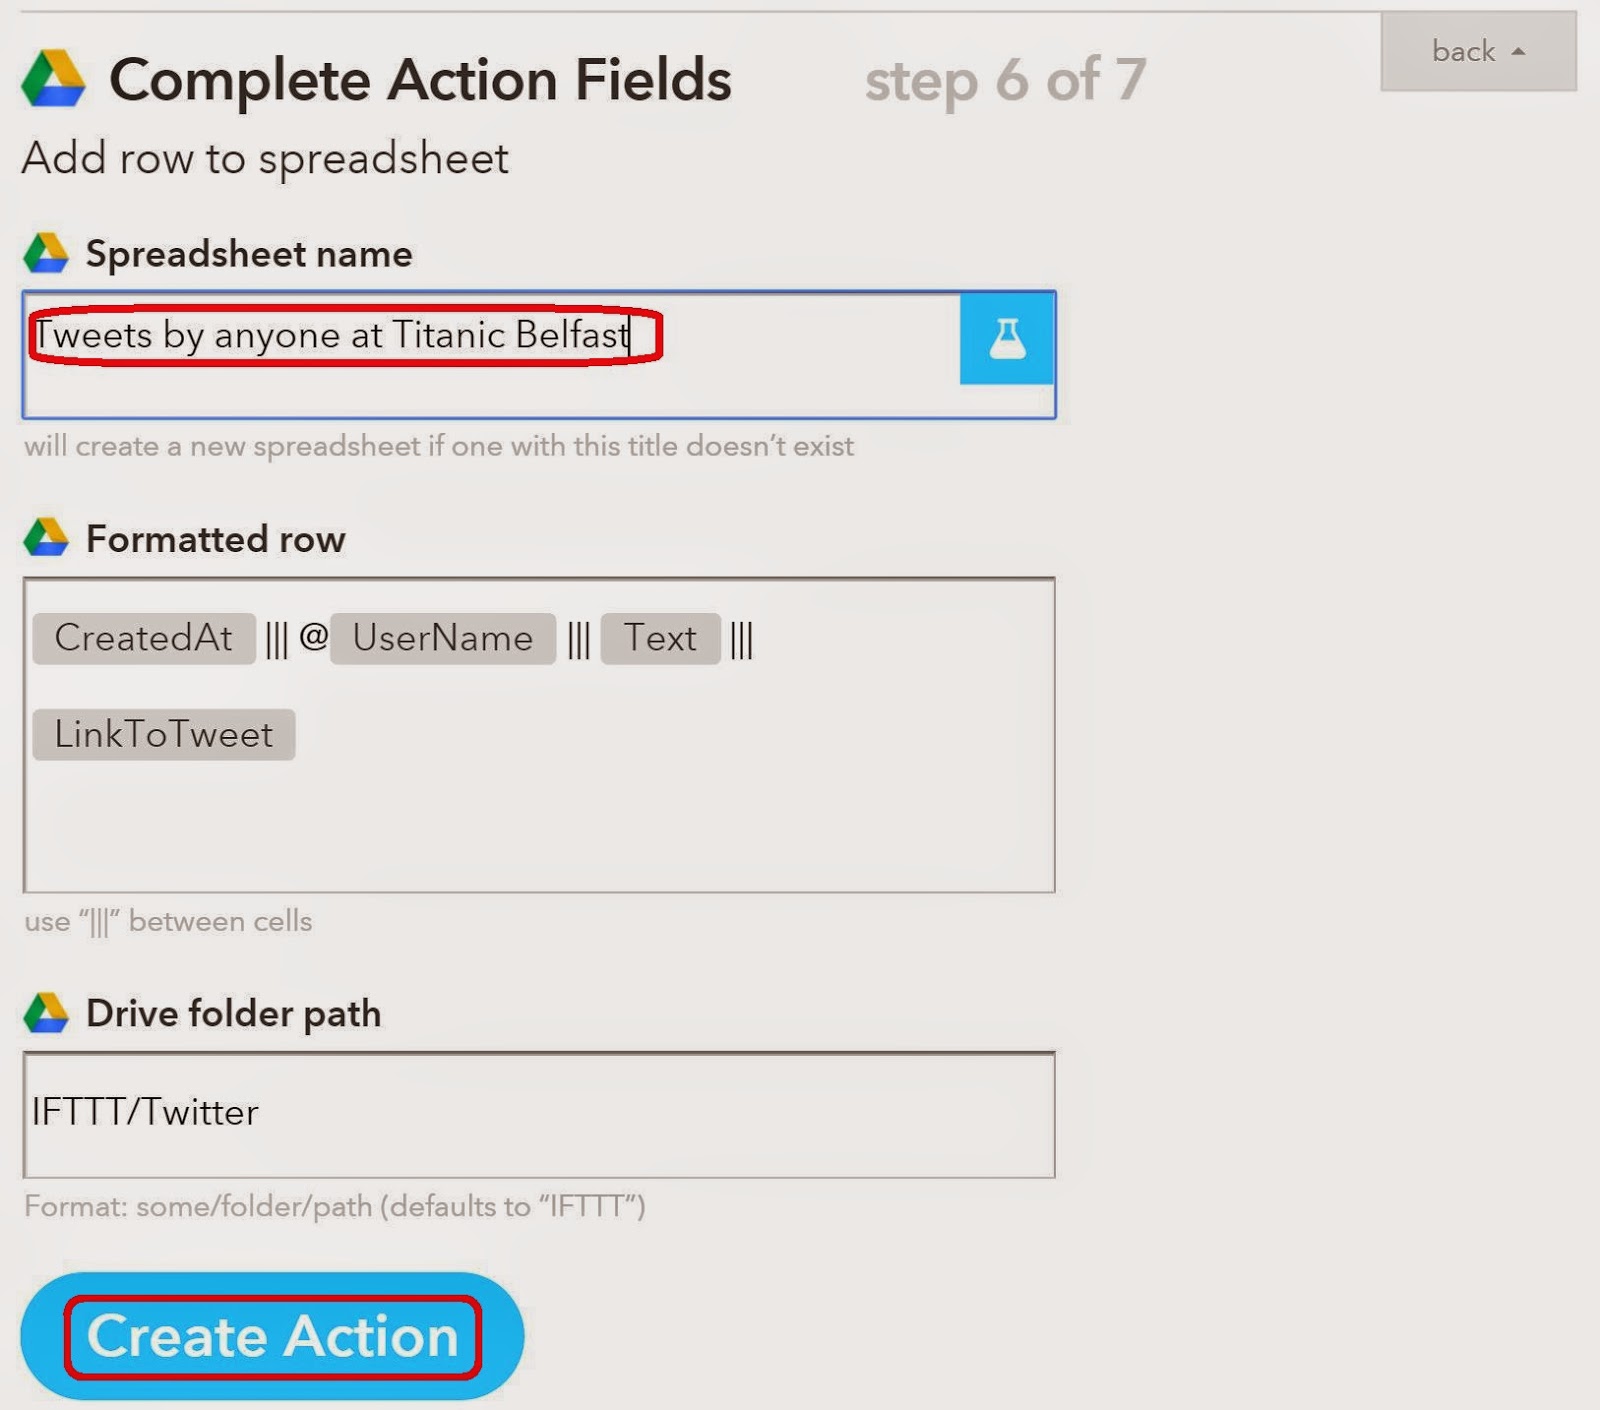
- When asked which action you wish Google Drive to select click on Add row to spreadsheet. This will actually create the spreadsheet for you and log all Tweets from your selected location.

- Great, now just name your spreadsheet and click on Create Action.
- You are now asked to name and create the recipe, almost done. So once you click on Create Recipe it should start logging Tweets from your chosen area. Go to your google drive after a while and see what has been logged..

- As a point to note, you may want to turn off the Receive notifications when this Recipe runs.
Subscribe to:
Posts (Atom)